Nebula ERP Solution

Power Bi

Transform Data into Strategic Insight

Microsoft Power BI is an enterprise-grade business intelligence (BI) and data analytics platform that empowers organizations to transform vast amounts of data into interactive dashboards, reports, and real-time business insights. With an intuitive user interface, deep integration with Microsoft products, and connectivity to hundreds of data sources, Power BI enables companies to make faster, smarter, and more informed decisions.

Designed for business leaders, analysts, and operations teams, Power BI helps break down data silos and replaces static reports with real-time visualizations that drive performance across departments—finance, sales, marketing, HR, operations, and beyond.

Example:
A CFO at a retail group uses Power BI to consolidate data from ERP, inventory, and sales systems into one interactive financial dashboard—tracking revenue, expenses, and profitability in real time, accessible from any device.

Introducing Microsoft Copilot in Power BI

AI-Powered Intelligence at Your Fingertips

The next evolution of Power BI comes with Microsoft Copilot—a generative AI companion built into the Microsoft ecosystem. Copilot supercharges the Power BI experience by simplifying analysis, automating report creation, and making advanced insights accessible through natural language interaction.

By combining Power BI’s data modeling and visualization power with Copilot’s intelligence, users can now:

This transforms Power BI from a powerful analytics tool into a conversational, predictive, and proactive business assistant.

Key Features of Power BI with Copilot

Natural Language Q&A

Ask data questions the way you think—Copilot understands. Whether you’re looking for trends, variances, or a breakdown by region, simply type or speak your question.

Example:
“Which product line generated the highest gross margin last quarter in Australia?”
Copilot instantly responds with a visual chart and a written summary:
“The Electronics category had the highest margin of 32.1%, driven by smartphone sales.”

Auto-Generated Reports and Dashboards

Describe the insights you need, and Copilot will build a custom dashboard with relevant visuals, filters, and summaries.

Example:
A regional manager types:
“Create a report comparing this year’s and last year’s revenue, segmented by region and product category, including a forecast.”
Copilot assembles a multi-page report with charts, tables, and a forecast model—ready for presentation.

AI-Powered Insights and Forecasting

Copilot identifies trends, detects anomalies, and recommends actions—reducing the burden on analysts.

Example:
In a logistics report, Copilot flags a sudden drop in on-time deliveries, linking it to a specific supplier’s late shipments and suggesting investigation.

Smart Narrative Summaries

Instead of interpreting complex charts, Copilot adds narrative text that summarizes key insights in executive-friendly language.

Example:
“Sales in Q1 increased by 8.5%, driven by strong performance in the Asia-Pacific region. Inventory turnover improved by 12%, reducing holding costs by $82,000.”

Smart Data Modeling

Copilot assists analysts in creating data relationships, hierarchies, and calculated measures using natural prompts.

Example:
An analyst types:
“Add a measure for Gross Profit Margin and segment by customer type.”
Copilot builds the DAX formula and applies the correct filters automatically.

Business Use Cases with Power BI + Copilot

Finance

Track profitability, forecast cash flow, and identify budget variances. Copilot Benefit: Auto-explains budget overruns and recommends corrective actions.
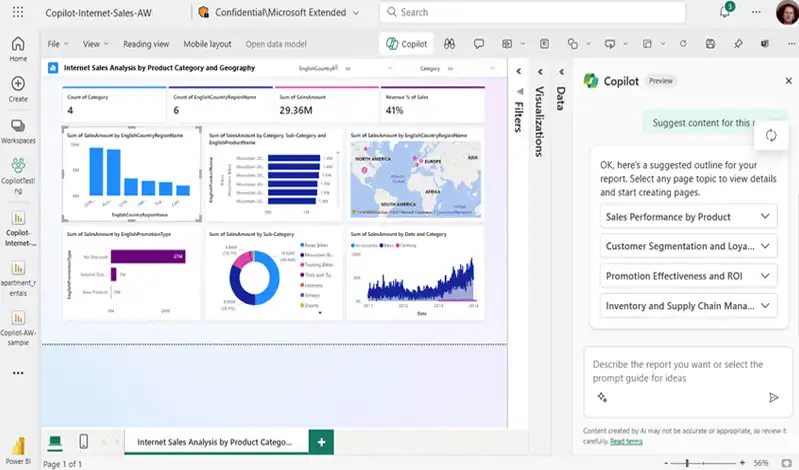
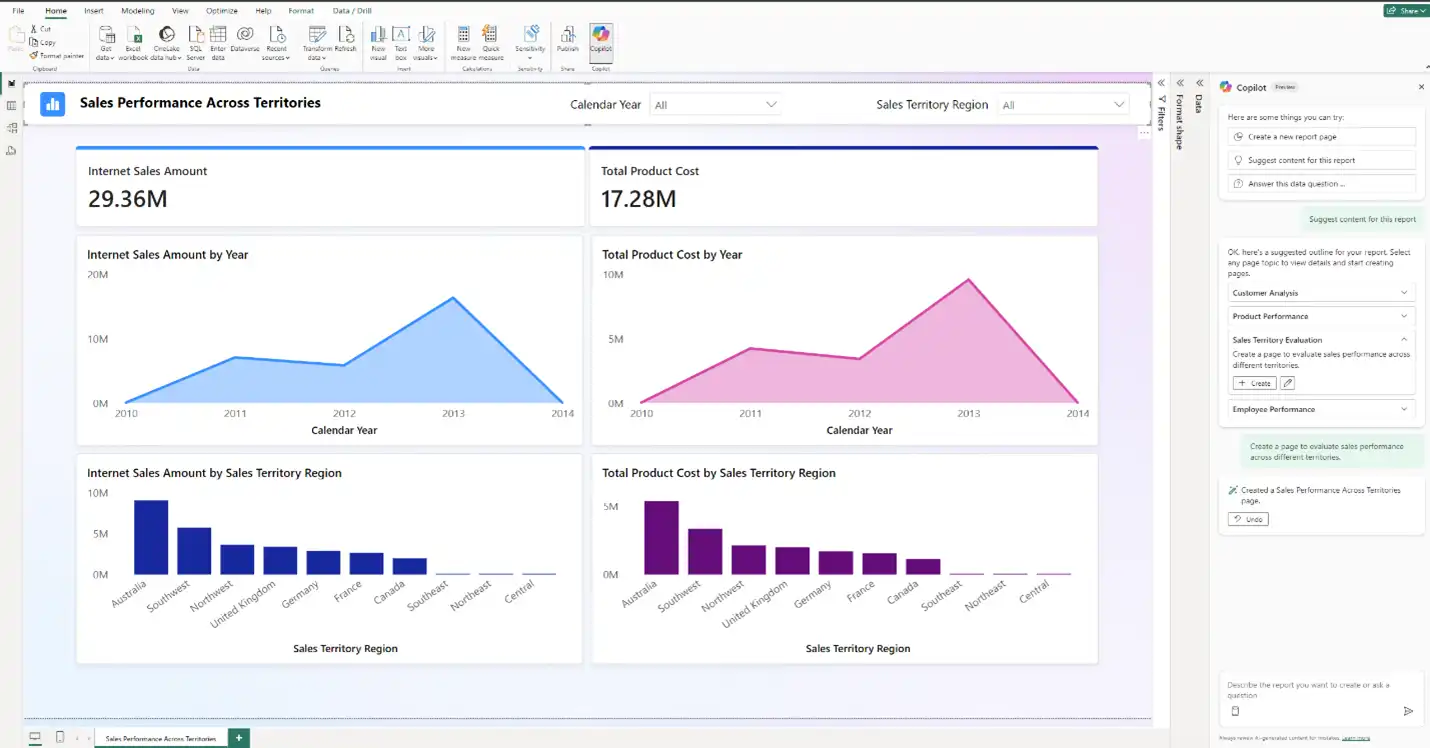
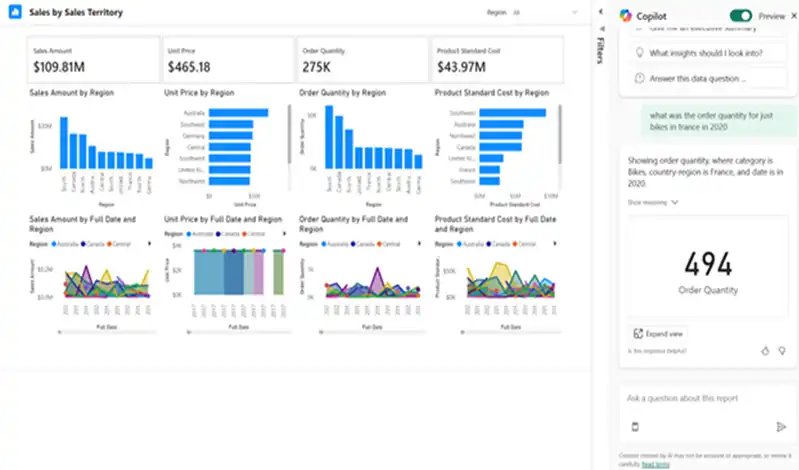
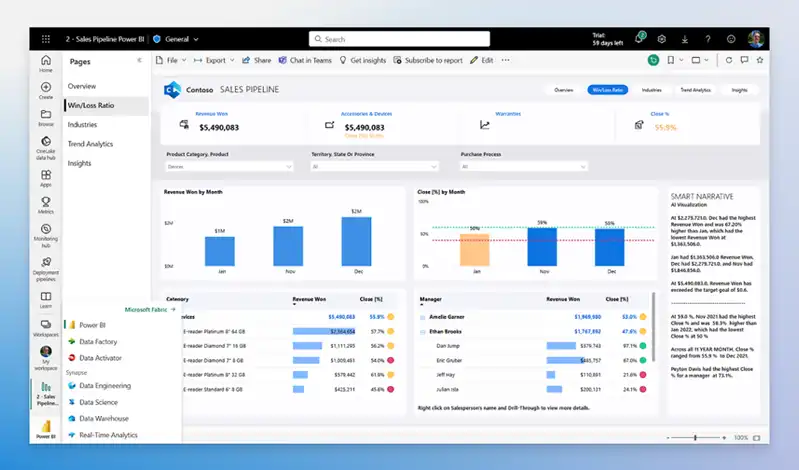
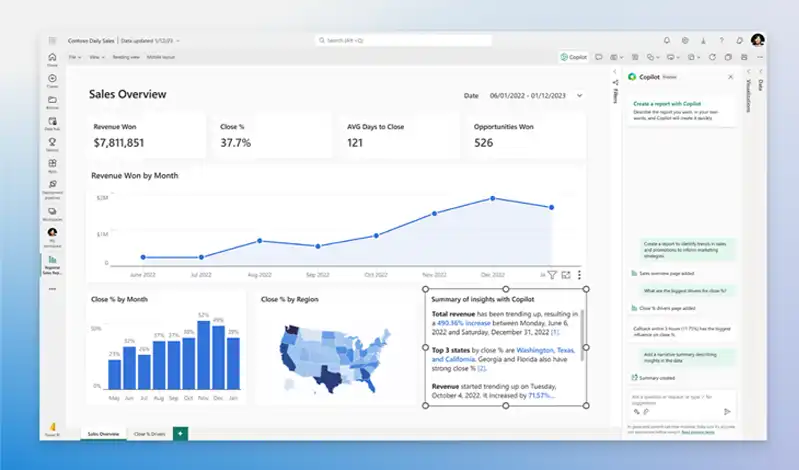
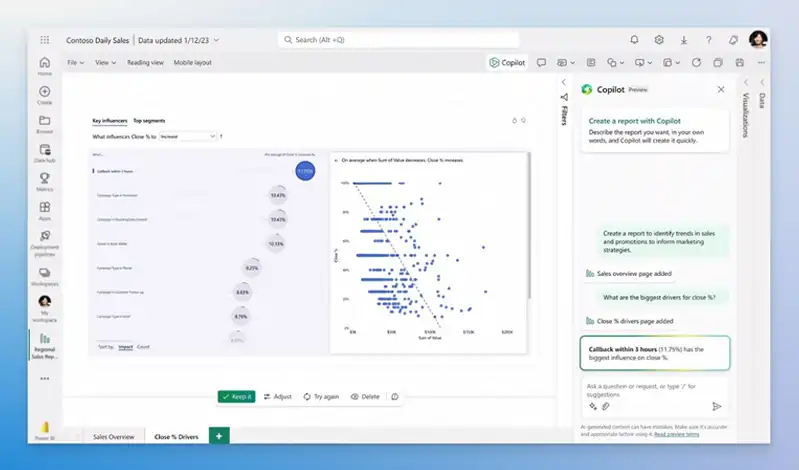
Sales

Monitor pipeline, conversion rates, and performance by rep, region, or product. Copilot Benefit: Forecast revenue trends and highlight declining accounts.

Manufacturing

Track OEE (Overall Equipment Effectiveness), production output, and defect rates. Copilot Benefit: Detects unusual machine downtime and correlates with maintenance logs.
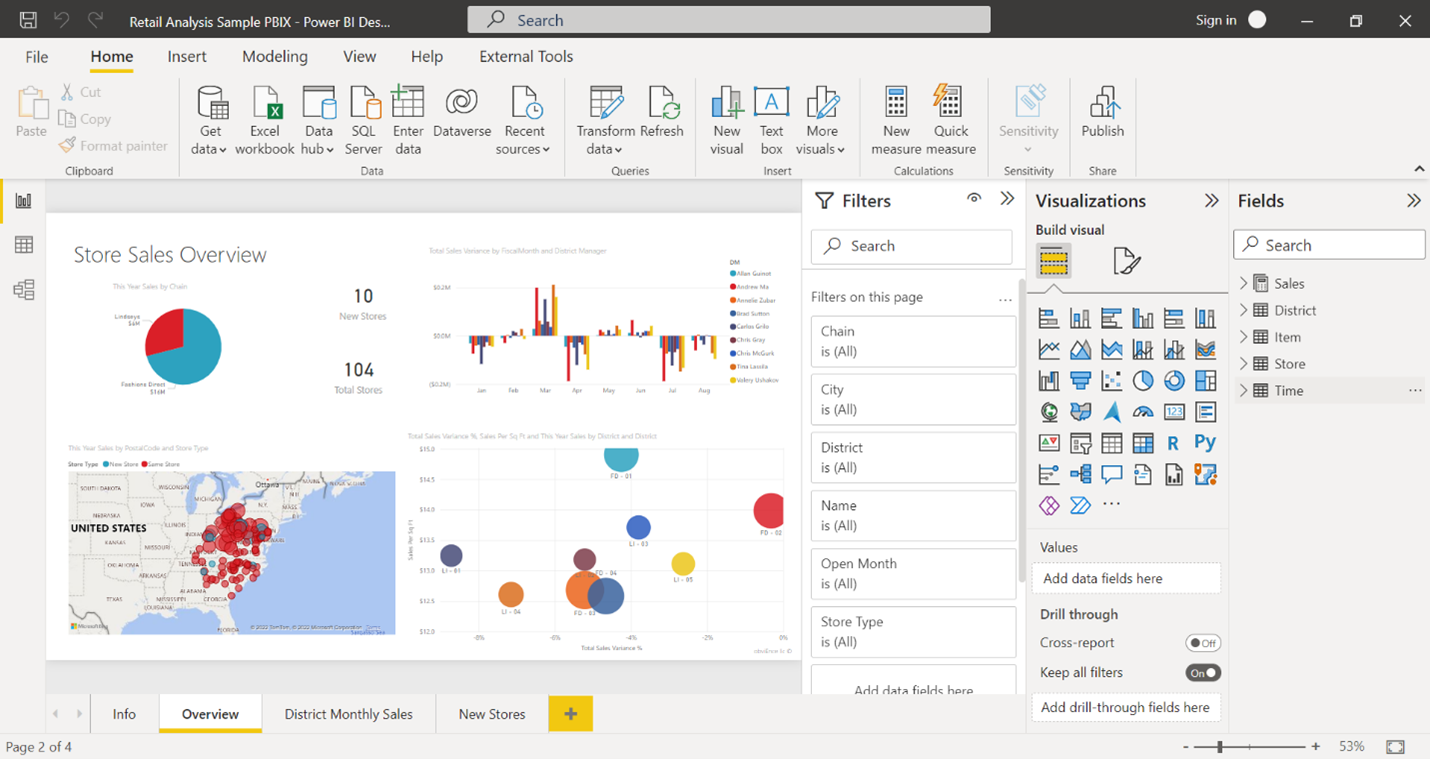
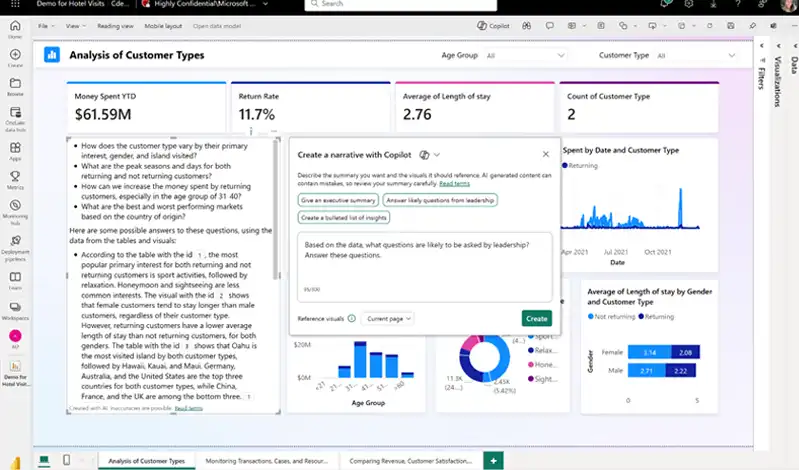
Retail

Analyze customer behavior, optimize inventory, and compare store performance. Copilot Benefit: Suggests stock reorder points based on sales trends and supply delays.

Logistics

Track delivery efficiency, fleet utilization, and cost per shipment. Copilot Benefit: Summarizes delivery KPIs and recommends adjustments to routes or vendors.

Integration Ecosystem

Example:
Sales and finance data from Dynamics 365 Business Central are pulled into Power BI. Copilot then provides weekly forecasts and alerts for negative margin transactions—shared automatically in Microsoft Teams.

Why Choose NEBULA for Power BI + Copilot?

As your trusted Microsoft partner, NEBULA helps you go beyond basic dashboards. We deliver intelligent reporting solutions powered by Copilot, tailored to your business model, KPIs, and industry needs.

Get Started with

Power BI + Copilot

Let NEBULA help you transform your data into a strategic advantage. Discover how Power BI with Copilot can streamline reporting, automate insights, and unlock new levels of productivity across your business.

Scroll to Top